Sustainable Software
#VisualGreenTech Challenge: Week 2
April 19, 2021
This week, I continued sketching for the #VisualGreenTech challenge by Microsoft's Developer Advocacy Team. This challenge is about spreading awareness and taking action this Earth Day. For my blog post, I wanted to compile all of the sketchnotes I have published on Twitter this week.
April 12
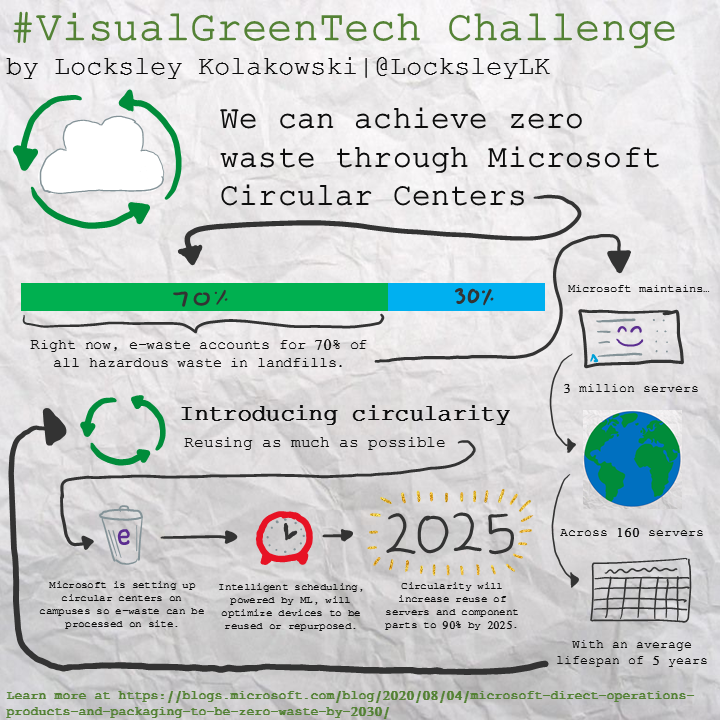
Prompt: Zero Waste means we encourage redesign of resource lifecycle to reduce waste. Visualize an action we can take to be zero waste!
April 13
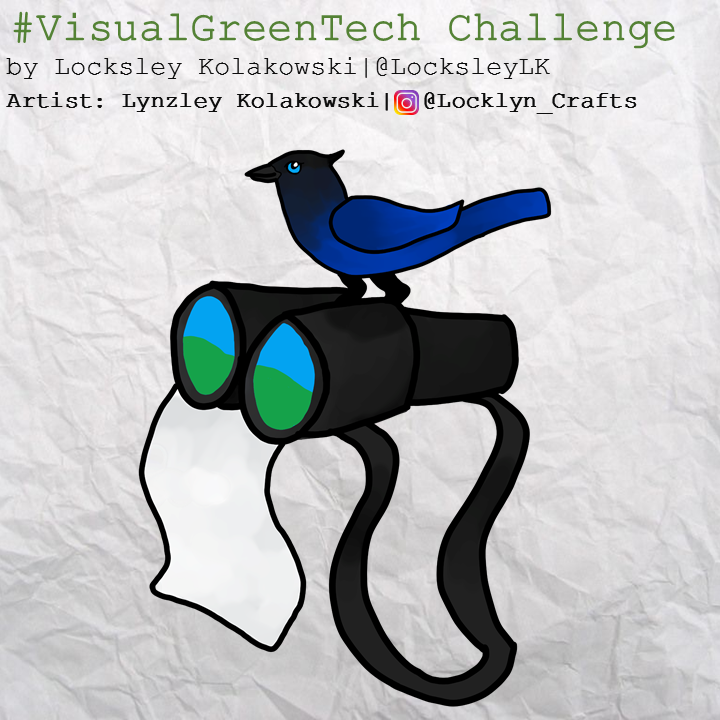
Prompt: Healthy Ecosystem means we collect and analyze data to understand & reverse declines. Visualize an action we can take for citizen science!
April 14
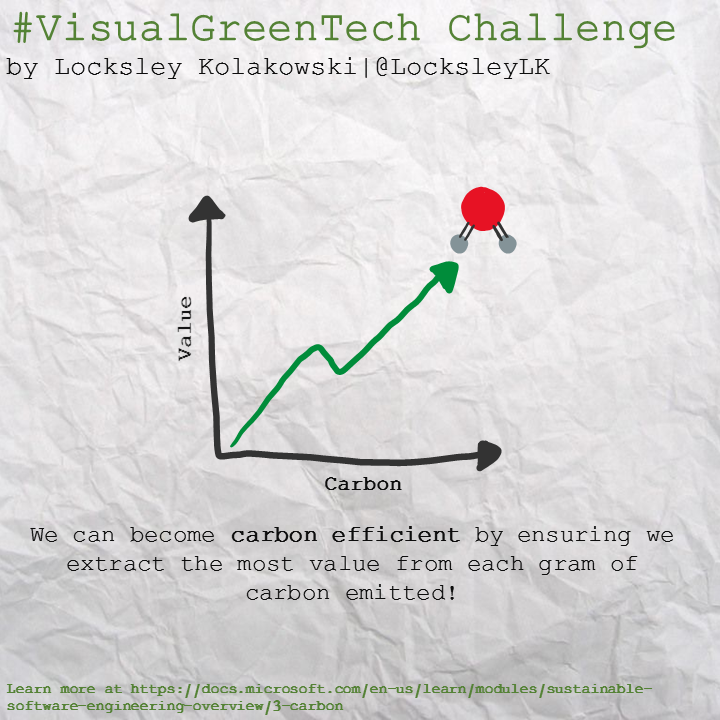
Prompt: Carbon is a measure of Greenhouse Gas (GHG) emissions. Visualize an action that makes us carbon-efficient!
April 15
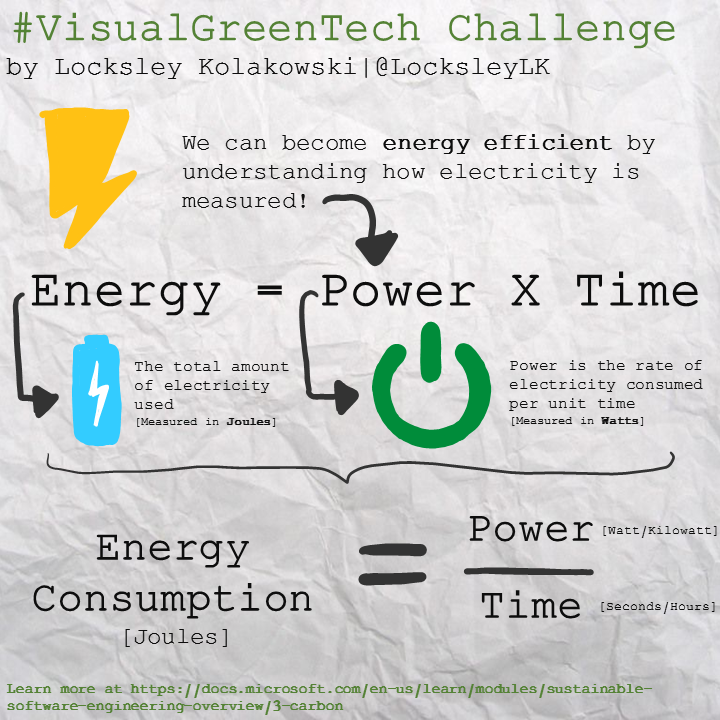
Prompt: Electricity & energy supply contribute the most to our carbon footprints. Visualize an action that makes us energy-efficient!
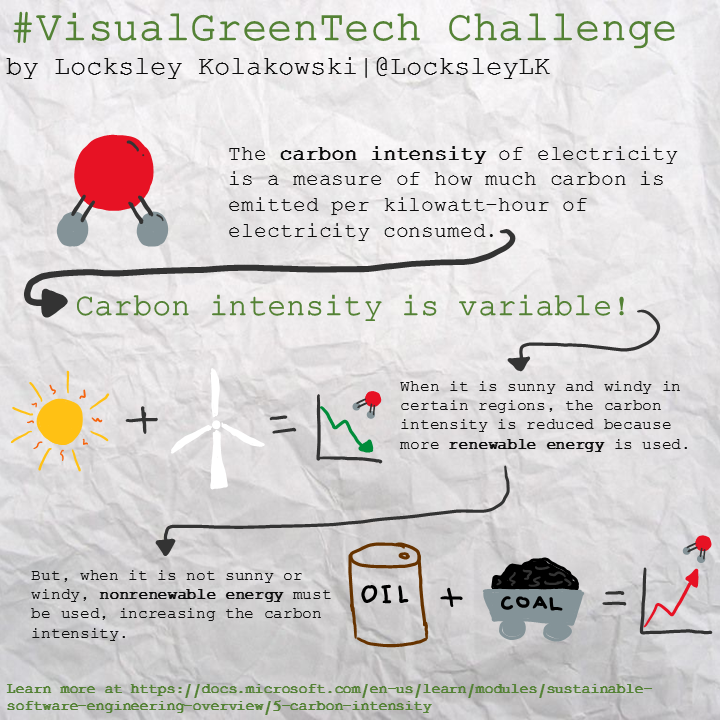
April 16
Prompt: Carbon intensity measures the carbon produced per kWh of electricity used. Visualize carbon intensity with an example or metaphor!
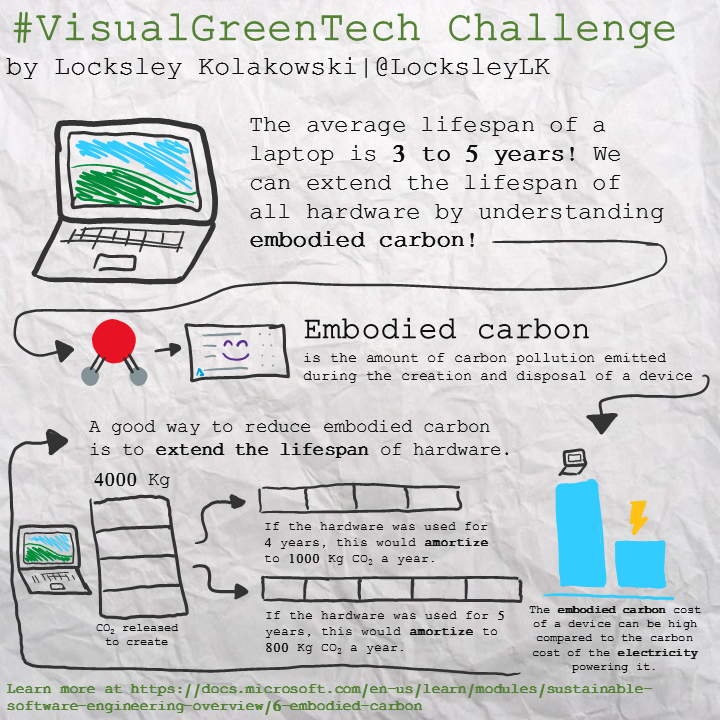
April 17
Prompt: Embodied carbon is like a fixed carbon cost for hardware creation & disposal. Visualize an action that extends hardware lifespan!
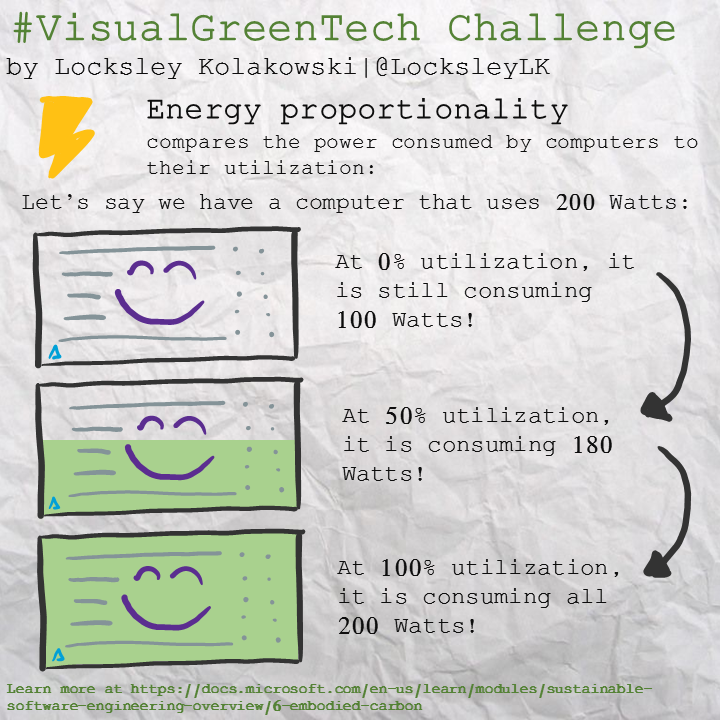
April 18
Prompt: Energy proportionality compares the power consumed by computers to their utilization. Visualize an action that maximizes computer utilization!
Learn more!
- Check out the Principles of Sustainable Software Engineering Microsoft Learn Module!
- Participate in the #VisualGreenTech Challenge!
- Read more about zero waste and Microsoft Circular Centers in this Microsoft blog.
- Check out Hello World on April 22 to see all of the #VisualGreenTech submissions and a possible cameo from me!